Working with the data for student achievement and Title 1 funding became an iterative process because the City assigns a DBN number to every school which proved very helpful as I used Excel’s VLOOKUP function to match the ELA and Math data to the Title 1 Fair Student Funding file which had to be transposed as the data was situated horizontally by row, and the file I had created situated the data vertically by column.
Title 1 funding for charter schools proved to be a challenge as they are not situated by DBN codes but by BEDS codes. Data from The New York World was similarly problematic because DBN codes were not assigned to this online interactive visualization. A google search provided a description of the functions SUM and LENS, that when used with the VLOOKUP function, matches and combines neighboring cells. The process was automated in this way so that data that was referenced by BEDS codes was matched to their DBN counterpart. I decided that using all available data to describe trends in ELA and MATH student achievement would best describe student achievement overtime, rather than focusing on specific grade levels. This posed a problem because the DOE’s reports listed the school names and years by column, and the results by row. I resituated the data by placing the year in a column heading next to other defining labels such as “Level of Student Achievement” and then applied Excel’s ISBLANK formula to automate the restructuring of the table.
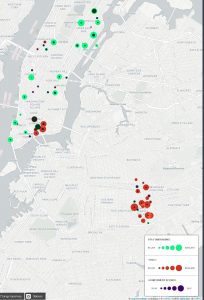
Fig. 6 Example of Bubble Map
Constructing the data in Carto was straight forward. I was concerned that the design of the minimally viable example that used the bubble style did not convey the information clearly, and changed the map to the category style, adding a description of the data that would serve this purpose better. Carto allows users of the free version four layers in which to situate their data.
The ability to differentiate the traditional and charter schools, as well as District 2 and District 23, was key to describing difference in terms of school type was essential. I used Adobe’s Color CC, a color picker tool, to define the exact color scheme to define categories that would be represented in the Carto legend. Carto is an open source mapping program that would have allowed greater control if I had the skillset to write code to format and define behaviors of the info-window. For instance, clicking on one location brings up a static info-window, while hovering over another location brings up an additional info-window that is available only if the user is hovering over that target. It would be advantageous if viewers were able to open as many as four or five info-windows at the same time to make comparisons simultaneously so that controlling these behaviors would be an important use of coding skills.